Birthweight and Child Wasting
Risk Exposures Overview
Child anthropometry is measured through several different correlated metrics, generally related to length/height, weight, and age. Relevant metrics include:
Metric |
Typical threshold value |
|---|---|
Gestational age |
Preterm birth: <37 weeks |
Birthweight |
Low birthweight: <2500 grams |
Length/height for age (LAZ/HAZ) |
Stunted: 2+ standard deviations below mean |
Weight for length/height (WLZ/WHZ) |
Wasted: 2+ standard deviations below mean |
Weight for age (WAZ) |
Underweight: 2+ standard deviations below mean |
Notably, these metrics tend to be highly correlated, with the magnitude of correlation varying with age. The metrics are related both through common causes as well as through suspected direct causal influences in some cases. The below diagram represents a causal framework for child growth metrics at birth as they relate to child growth metrics throughout the pre- and post-natal periods, as presented by [Na-et-al-2020].
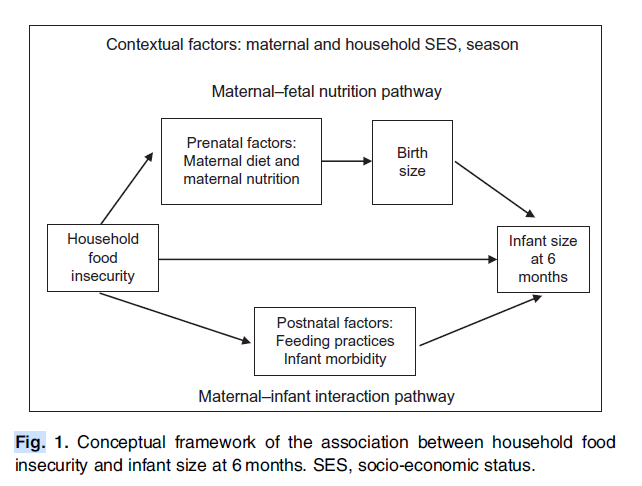
Notably, it is critical to distinguish between the correlation between these metrics attributable to shared common causes between them from correlation between these metrics attributable to direct causal relationships. However, the influence of confounding factors in the estimation of the causal relationship between these factors must be carefully considered due to the high correlation between them and the observational nature of child anthropometry studies. Additionally, child age should be considered as an important effect modifier in the associations between each of these metrics, as discussed by [Alderman-and-Headey-2018].
Correlation
Spearman correlation coefficients between birthweight and WLZ among the first two years of age were estimated from the MAL-ED study [MAL-ED-investigators-2014], available in this spreadsheet and presented in the figure below.
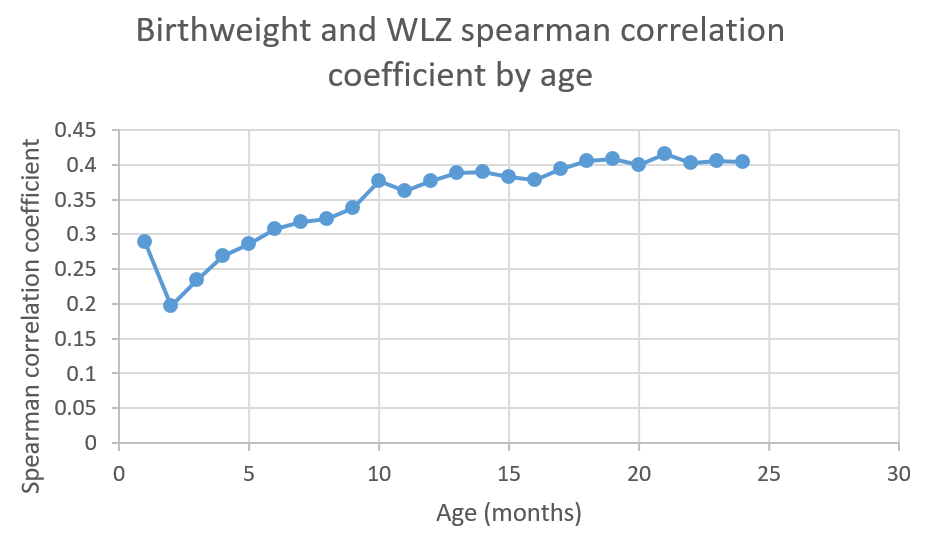
Note
These correlation coefficients were estimated by Chris Troeger for previous work on risk correlation for the Balanced Energy Protein simulation.
Causation
On 8/12/2021, we performed a literature search on PubMed using the search terms (“birthweight” and “wasting”), which yielded 380 results. After screening the paper titles and abstracts and reviewing relevant studies, the most relevant source or the causal association between birthweight and child wasting is an analysis of twin pairs using DHS data performed by [McGovern-et-al-2019].
[McGovern-et-al-2019] reports that the marginal effect of a 200g increase in birthweight (at 2500g) is associated with a 1.1-1.2 percentage point decrease in the probability of wasting. [McGovern-et-al-2019] was selected as a desireable data source as it is an analysis of twins and sibling pairs, a study design that is particularly advantageous for the control for confounding due to familial influence, and also provides continous estimates of the association between birthweight and wasting status. While this analysis was not confounded by gestational age due to the study design of evaluating twins, effect modification by gestational age was not considered. Additionally, the effect of birthweight on wasting was measured among a population of children five years of age and younger, although [McGovern-et-al-2019] reports that the association was strongest among younger children. Due to the heterogenety of effects by age as well as the mortality selection bias, the effect of birthweight on wasting obtained from [McGovern-et-al-2019] may be an underestimate, particularly as it applies to the youngest age groups. Further, [McGovern-et-al-2019] modeled a quadratic term for birthweight and reported the marginal effect at 2500g.
There are several additional studies that report the association bewteen low birthweight and wasting status with attempted control for confounding factors such as maternal characteristics, socioeconomic status, etc. Examples of such analyses include a study by [Christian-et-al-2013] that found low birthweight to be associated with 2.3-3.5 the odds of childhood wasting. [Christian-et-al-2013] also assessed additional exposures including small for gestational age (SGA), preterm, and four categories including 1) adequate for gestational age (AGA) and term (reference category), 2) AGA and preterm, 3) SGA and term, 4) SGA and preterm. Notably, this data source was used in the [Optima-Nutrition-Model-wasting-bw] a model that includes of dynamic child wasting that is an adaptation of the Lives Saved Tool (LiST) that was utilized in [Scott-et-al-2020-wasting-bw]; however, this paper assumed an effect size for child wasting equal to that of stunting. Additionally, [Christian-et-al-2013] is an observational study that did not adjust for confounding beyond by child age, but reported that adjusting for child’s sex, twins, infection, child and maternal interventions, parity, socioeconomic status, maternal education and maternal infection did not change the risk estimates. [Christian-et-al-2013] reported that this analysis “revealed no evidence of strong confounding and showed a dose-response relationship, indicating possible causal associations” (p. 1351).
Risk Exposures in GBD
GBD models the correlated joint distribution of gestational age and birthweight as a single low birth weight and short gestation (LBWSG) risk factor. However, GBD does not consider the joint distribution of other risk exposures related to child anthropometry. Therefore, we will model risk-risk correlation of GBD risk exposures between LBWSG with wasting (and others) separately from the GBD in Vivarium.
Notably, in GBD, there are LBWSG risk exposures at birth and among the early and late neonatal age groups only. For the child growth failure risks (wasting, stunting, and underweight), there are risk exposures for all age groups under five years, although risk effects for these risks apply to the post-neonatal and 1-4 age groups only.
Links to documentation for relevant risk exposure pages include:
Vivarium Modeling Strategy
The strategy for modeling risk-risk correlations related to child anthropometry in this document was developed for the needs of the acute malnutrition treatment and prevention simulation. Different strategies may be more appropriate for different project needs and should be reevaluated when necessary.
In GBD, the birthweight exposure distribution is tracked through the late neonatal age group (28 days after birth) and affects the risk of mortality during this period. For the acute malnutrition treatment and prevention simulation, child wasting exposures are modeled as a dynamic transition model (documented here) rather than a standard static propensity-based risk exposure model (such as the stunting risk exposure model). Therefore, there will be two approaches to modeling the correlation and causal association between birthweight and wasting, including 1) the initialization of wasting risk exposure at birth based on a simulant’s birthweight exposure value, and 2) the correlation between a simulant’s propensity for wasting incidence over time (“x-factor”), discussed in the acute malnutrition treatment and prevention concept model document, with their birth weight exposure.
Correlation
Initialization
When simulants are initialized into the early or late neonatal age groups or born into the simulation, they will be assigned a birthweight exposure value associated with their LBWSG risk exposure. Additionally, when simulants are initialized into the early or late neonatal age group and when they are born into the simulation, they will be initialized into a particular state in the wasting model (e.g. TMREL, mild wasting, moderate wasting, or severe wasting) based on their birthweight exposure value according to the steps below. NOTE: simulants who are initialized into age groups older than the late neonatal age group will not be assigned a birthweight exposure, so they should be assigned a wasting exposure value that is independent of birthweight.
Note
Wasting exposures at birth and in the early and late neonatal age groups will be initialized using the wasting exposure distribution for the 6-11 month age group, as described in the wasting exposure model document.
Assign the simulant a birthweight exposure value specific to their age group and additional attributes that affect birthweight (i.e. intervention coverage, maternal BMI risk exposure, etc.)
Assess the percentile of a simulant’s birthweight exposure value (after application of all birthweight-affecting variables in the baseline scenario but before the application of new intervention coverage in the alternative scenario) within the overall sex, location, and year-specific birthweight exposure distribution at birth.
Assign the simulant a wasting propensity that is correlated to their birthweight percentile according to the spearman correlation coefficient of birthweight and wasting at six months of age (mean: 0.3083092, standard deviation: 0.02225747, normal distribution of uncertainty). This should be done according to the methodology described in the risk-risk correlation page.
Assign the simulant a wasting exposure based on their wasting propensity and their sex/location/year-specific wasting exposure distribution among the 6-11 month age group (for all age groups including birth, early neonatal and late neonatal) such that the propensity is equal to the percentile within the exposure distribution.
Warning
Given that the 6-11 month age group wasting exposure distribution is used to inform wasting exposures at birth and correlated with birthweight exposure, the wasting exposure distribution between birth and the the 6-11 month age group will shift towards the TMREL as a result of the higher mortality rates among simulants with lower birthweight (which also tend to have worse wasting exposures).
The magnitude of this bias should be evaluated upon implementation to determine if an alternative modeling strategy is necessary. Validation criteria for this evaluation will be comparing the wasting exposure distribution among the post neonatal age group in the simulation to GBD as well as evaluating the relative improvement in the wasting exposure distribution in the simulation across early to post neonatal age groups.
An alternative modeling strategy could be to not assign wasting exposures until the 6-11 month age group and induce correlation with birthweight exposures at that point. (This stragey is more complicated to implement from an engineering standpoint given the unassigned exposure values for the age groups younger than 6 months. Additionally, this strategy would be limited in that it would require an assumption regarding the difference in the birthweight exposure distribution between one and six months of age given that GBD does not estimate birthweight exposures beyond the late neonatal age group).
Transitions
Todo
Add detail on how to correlate wasting x-factor propensity to birthweight exposure
This will be done through the correlation between maternal BMI (proxy measure for x-factor risk exposure) and birthweight
Causation
For interventions that impact birthweight, there should be a corresponding change in a child’s wasting risk exposure attributable if the impact of the intervention on wasting is not modeled directly.
Initialization
For each gram increase in a simulant’s birthweight due to a simulation intervention, the category 1 (severe wasting/SAM) and category 2 (moderate wasting/MAM) exposures used to determine the probability of initialization into those states should be reduced proportionately such that the total reduction in moderate and severe wasting exposure prevalence is equal to 0.0115 / 200 = 0.0000575. The exposure prevalence of category 3 (mild wasting) should be increased by 0.0115 / 200 = 0.0000575. The figure below demonstrates how to implement this change visually. This change in the wasting expousure distribution thresholds attributable to a change in birthweight should be implemented at birth, after the calculation of the simulant’s wasting initialization propensity correlated with their birthweight percentile, as described above.

Note
We will only consider the causal impact of birthweight on wasting exposure as it relates to new intervention coverage in the alternative scenario in our models. We will assume that the birthweight/wasting correlation captures this causal relation otherwise.
Transitions
We will conservatively assume that an increase in a simulant’s birthweight exposure does not result in a change of their wasting exposure incidence rates.
Assumptions and Limitations
The application of the size from [McGovern-et-al-2019] makes the following assumptions:
The effect size is entirely causal and not subject to confounding
The effect between BW and wasting measured among children under five is applied to prevalent wasting status at six months of age only and does not affect future wasting exposure trajectories (aside from any associated vicious cycle effects).
The effect of BW on wasting applies proportionately to moderate and severe wasting
Validation Criteria
The LBWSG and wasting risk exposures should continue to validate to the GBD risk exposures in the baseline scenario after the induction of correlation betwen the risk exposures. This is an especially critical validation criteria given our expected bias this modeling strategy will introduce as described in the “important” note above.
For interventions that improve birthweight, the prevalent severe and moderate wasting risk exposures should be lower and the mild wasting risk exposure should be higher in the baseline than alternative scenario among individuals covered by the intervention. The TMREL wasting risk exposure should not change between scenarios.
Todo
Determine the outputs feasible to include in simulation stratification (ex: BW<2500 stratification, or select LBWSG categories) for verification purposes OR determine how to verify and validate through interactive simulations
Would be ideal to investigate:
How the correlation between BW and wasting evolves as simulants age
Compare OR of wasting by LBW status to external literature sources (OR~2.2-3.5 from [Christian-et-al-2013] as well as other sources)
References
Alderman H, Headey D. The timing of growth faltering has important implications for observational analyses of the underlying determinants of nutrition outcomes. PLoS One. 2018 Apr 25;13(4):e0195904. doi: 10.1371/journal.pone.0195904. PMID: 29694431; PMCID: PMC5919068. https://pubmed.ncbi.nlm.nih.gov/29694431.
Christian P, Lee SE, Donahue Angel M, Adair LS, Arifeen SE, Ashorn P, Barros FC, Fall CH, Fawzi WW, Hao W, Hu G, Humphrey JH, Huybregts L, Joglekar CV, Kariuki SK, Kolsteren P, Krishnaveni GV, Liu E, Martorell R, Osrin D, Persson LA, Ramakrishnan U, Richter L, Roberfroid D, Sania A, Ter Kuile FO, Tielsch J, Victora CG, Yajnik CS, Yan H, Zeng L, Black RE. Risk of childhood undernutrition related to small-for-gestational age and preterm birth in low- and middle-income countries. Int J Epidemiol. 2013 Oct;42(5):1340-55. doi: 10.1093/ije/dyt109. Epub 2013 Aug 6. PMID: 23920141; PMCID: PMC3816349. https://pubmed.ncbi.nlm.nih.gov/23920141/
The MAL-ED Network Investigators, The MAL-ED Study: A Multinational and Multidisciplinary Approach to Understand the Relationship Between Enteric Pathogens, Malnutrition, Gut Physiology, Physical Growth, Cognitive Development, and Immune Responses in Infants and Children Up to 2 Years of Age in Resource-Poor Environments, Clinical Infectious Diseases, Volume 59, Issue suppl_4, November 2014, Pages S193–S206, https://doi.org/10.1093/cid/ciu653
McGovern, M. E. (2019). How much does birth weight matter for child health in developing countries? Estimates from siblings and twins. Health economics, 28(1), 3-22. https://pubmed.ncbi.nlm.nih.gov/30239053.
Na M, Shamim AA, Mehra S, Labrique A, Ali H, Wu LS, Shaikh S, Klemm R, Christian P, West KP. Maternal nutritional status mediates the linkage between household food insecurity and mid-infancy size in rural Bangladesh. Br J Nutr. 2020 Jun 28;123(12):1415-1425. doi: 10.1017/S0007114520000707. Epub 2020 Feb 27. PMID: 32102702. https://pubmed.ncbi.nlm.nih.gov/32102702.
Pearson R, Killedar M, Petravic J, Kakietek JJ, Scott N, Grantham KL, Stuart RM, Kedziora DJ, Kerr CC, Skordis-Worrall J, Shekar M, Wilson DP. Optima Nutrition: an allocative efficiency tool to reduce childhood stunting by better targeting of nutrition-related interventions. BMC Public Health. 2018 Mar 20;18(1):384. doi: 10.1186/s12889-018-5294-z. Erratum in: BMC Public Health. 2018 Apr 26;18(1):555. https://pubmed.ncbi.nlm.nih.gov/29558915
Scott, N., Delport, D., Hainsworth, S. et al. Ending malnutrition in all its forms requires scaling up proven nutrition interventions and much more: a 129-country analysis. BMC Med 18, 356 (2020). https://doi.org/10.1186/s12916-020-01786-5